See our Newest Features in Data Dynamics
Fannie Mae's unique Data Dynamics® analytical tool has been enhanced in response to investor feedback. With this newest enhancement, we now provide:
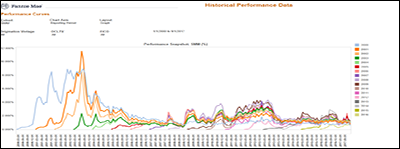
• Performance curves within the Historical Performance Data Dashboard (click image below to view full size)
- Previously, market participants were able to view only a snapshot of the most recent performance data available.
- With this enhancement, users can now observe the performance of historical origination vintages at every point in time since the acquisition of the loan.
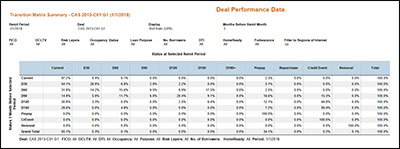
• A Delinquency Transition Matrix within the Connecticut Avenue Securities™ (CAS) and Credit Insurance Risk Transfer™ (CIRT™) deal issuance and performance data dashboards (click image below to view full size)
- Prior to this change, market participants were only able to view the one month delinquency roll performance for cohorts of loans over all historical periods.
- Now, users can select to view the delinquency roll performance on a cohort of loans from a one-month or three-month viewpoint.
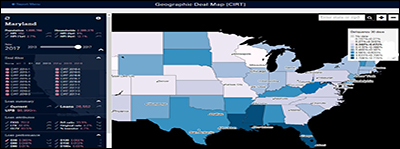
• A Geographic Deal Map for the CIRT program (click image below to view full size)
- Market participants now have an Interactive view into CIRT transaction characteristics and performance by state or 3-digit zip code.
- Users can compare collateral, delinquency trends, and home price changes across deals, regions, and remittance periods.
We're committed to continuing to evolve Data Dynamics to add new perspectives and insights. Please visit often, and please share your feedback. Reach out to the Fannie Mae Investor Help Line at 1-800-232-6643 or by email with feedback or questions.
Updated 02/23/18


