Connecticut Avenue Securities (CAS) June 2017 Remittance
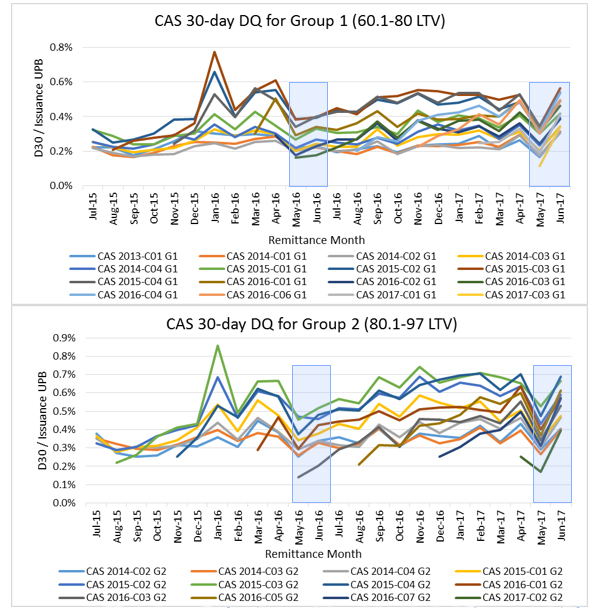
Fannie Mae released its monthly Connecticut Avenue Securities™(CAS) remittance data today, illustrating performance of loans in its CAS deals during the month of April 2017. In today's release the number of loans experiencing a 30-day delinquency increased relative to last month's (May 2017) remittance report, which reflects March activity. The increase directly follows a dip in last month's remittance, as illustrated in the charts below. This Commentary provides some color around the potential sources for this performance pattern, and also suggests that 60-day delinquency rates are a more meaningful measure of near-term performance analysis.
Source: CAS Monthly Remittance Files (http://www.ctslink.com/SelectSeries.do?shelfType=MBS&shelfId=FNMA)
March and April Seasonality
If we look to Fannie Mae’s Historical Loan Performance Data, we see some seasonal performance patterns that may explain part of this trend. Historically, we generally observe a decrease in the percentage of loans that are 30-days delinquent in March and a corresponding increase in April. The graph below shows the change in the number of 30-day delinquencies month over month with March and April data points highlighted with a red-lined box. The trend indicates that the increase in delinquencies in April is a reversion to the mean, and that the March decrease represents seasonal performance patterns.
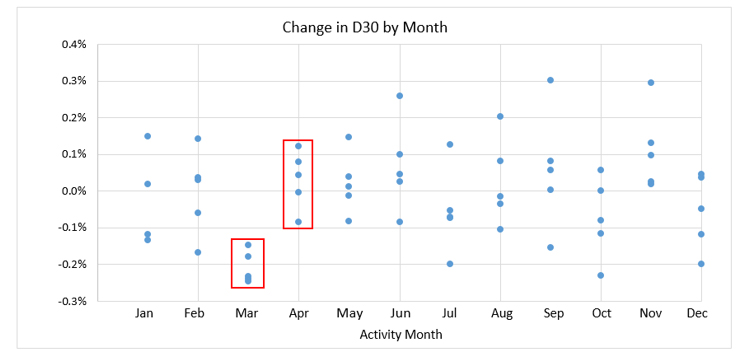
Source: Fannie Mae Single-Family Loan Performance Data (www.fanniemae.com/loanperformance)
There are a few potential reasons for this phenomenon. One is that tax refunds become available during the first quarter of the year. Borrowers who were previously 30-days delinquent may make a March payment with the one time check, but could then fall delinquent again with their April payments. Another possibility is that borrowers who missed payments due to potential overspending during the holiday season may have had enough time to build funds back up in order to make a payment. The second theory contributes to the March dip, but would not explain the following month’s spike.
The Sunday Effect
Another performance pattern that may accentuate the increase in 30-day delinquencies in the April 2017 payment period has to do with the day of the week on which the month ends. An interesting phenomenon that is observable in historical mortgage performance data are regular spikes in 30-day delinquencies for months that end on a Sunday. In the graph below, all months ending on a Sunday are indicated by red dots. The largest increases in the number of 30-day delinquencies from 2012 to 2016 took place on months ending on Sunday. The one exception is in March 2013, where it appears that the effect of the seasonal March dip is stronger than that of the otherwise expected Sunday spike.
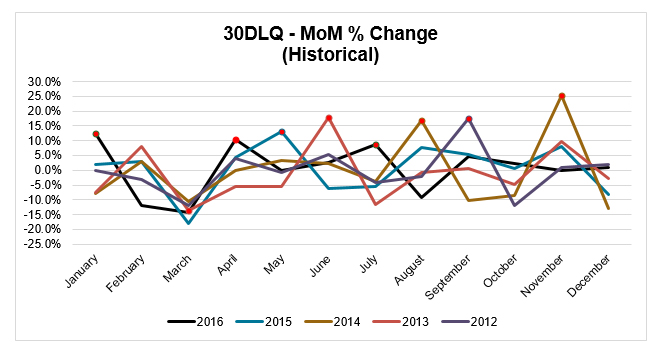
Source: Fannie Mae Single-Family Loan Performance Data (www.fanniemae.com/loanperformance)
The Sunday effect does not only appear in relative terms. The graph below shows the percent of current unpaid principal balance (UPB) that rolls to 30-days delinquent aggregated by the last day of the month in which it went delinquent. From 2010 through 2016, months ending on a Sunday experience roll rates roughly 30% higher than most days later in the week.
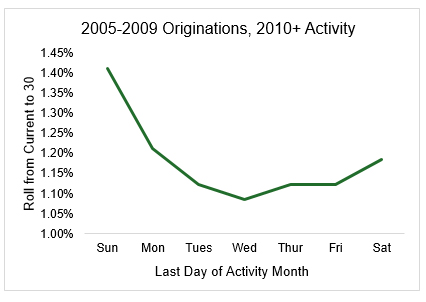
Source: Fannie Mae Single-Family Loan Performance Data (www.fanniemae.com/loanperformance)
One theory for this behavior is that some borrowers wait until the very end of the month to make mortgage payments. If a month ended on a Sunday, mortgage servicers would not receive these payments or apply these payments until the following Monday, the first day of the new month.
Recent CAS Delinquency Increase
In the remittance data posted today (corresponding to the April payment), there is an increase in 30-day delinquencies that appears particularly dramatic relative to the prior month, given the notable decrease in 30-day delinquencies in the March activity period. We suggest that one can attribute this increase to the two effects described above. The loans experience the usual reversion back to mean in April relative to the decrease in 30-day delinquencies seen in the March activity, but, in addition, April 2017 ended on a Sunday, which compounds the effect on performance.
Performance Tracking
When tracking single-family mortgage loan performance, we focus more on 60-day delinquencies as opposed to 30-day delinquencies as an early performance indicator. Although seasonal and behavioral trends are still visible, we find that 60-day delinquency rates are less volatile and more indicative of ongoing performance. The charts below, representing 60-day delinquency performance for the same transactions, illustrate the same long-term trends as the 30-day delinquency charts (at the top of this piece), but do not suffer from the same level of noise and volatility.
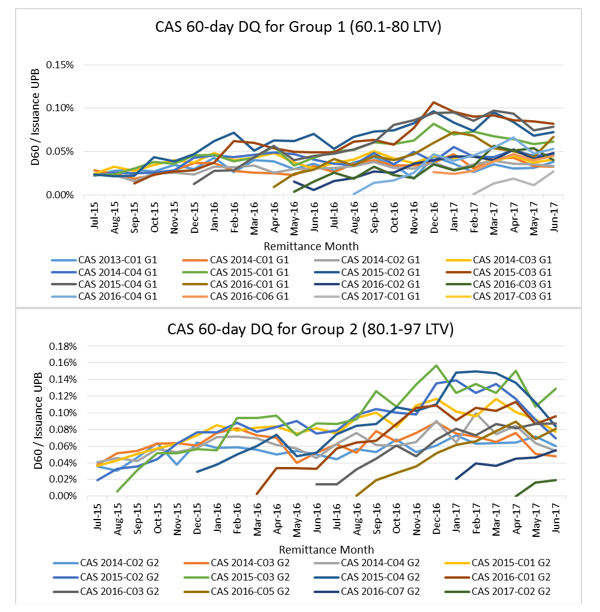
Source: CAS Monthly Remittance Files (http://www.ctslink.com/SelectSeries.do?shelfType=MBS&shelfId=FNMA)
For questions and feedback, please contact the Fannie Mae Investor Help Line at 1-800-2FANNIE, Option 2, or by e-mail.
This commentary is provided by Fannie Mae solely for informational purposes based on information available at the time it is published. It is subject to change without notice. Fannie Mae disclaims any responsibility for updating the commentary or the opinions or information discussed herein.
The opinions presented in the commentary represent the views of professionals employed by Fannie Mae of certain factors that may impact the performance of certain loans in Connecticut Avenue Securities reference pools. Fannie Mae does not represent that such views are the sole or most accurate explanations for loan performance or that there are not credible alternative views or opinions. Fannie Mae publishes this commentary as a service to interested parties and disclaims any liability for any errors contained herein. This commentary does not constitute investment advice and must not be relied upon as such. Readers must make their own assessments of the factors that impact loan performance.
This commentary may contain forward looking statements and opinions regarding future performance. Any such statements are based on the company's current assumptions regarding numerous factors and are subject to change. Actual outcomes may differ materially from those reflected in the forward looking statements or opinions.
This commentary does not constitute an offer to sell or the solicitation of an offer to buy any security. Before investing in any Fannie Mae security, potential investors are advised to consult with their own counsel and investment advisors and to read the prospectus and other offering documents pursuant to which such security is issued as well as the company's most recently issued quarterly report on Form 10-Q and its most recent annual report on Form 10-K.